Making a phylogenetic tree

Image: Pixabay

I thought I’d take a moment to discuss how exactly biologists create phylogenetic trees. Our discussion will not include factors such as morphological comparisons etc.- which was more widely used before genetics came along- but rather the molecular methods used today. I thought this would be better served as a blog post rather than a podcast episode, as in blog format I can use images to illustrate what I’m saying (which is predictably rather difficult in audio format!).

So, let’s say that you’re an ecologist who’s just discovered an uninhabited island far out to sea. There’s three species of snake on this island (hence the picture at the top) and you want to know how long ago these species diverged from their common ancestor. You find a fossil which tells you that species A and species C must have diverged 15 million years ago, but you can’t find anything for the other species. So, instead, you sequence a protein common to all species (let’s say haemoglobin for the sake of argument) which gives you the results in Table 1. How does this help you?

Table 1: The number of amino acids in the protein we’re sequencing that are different between each of the three snake species.

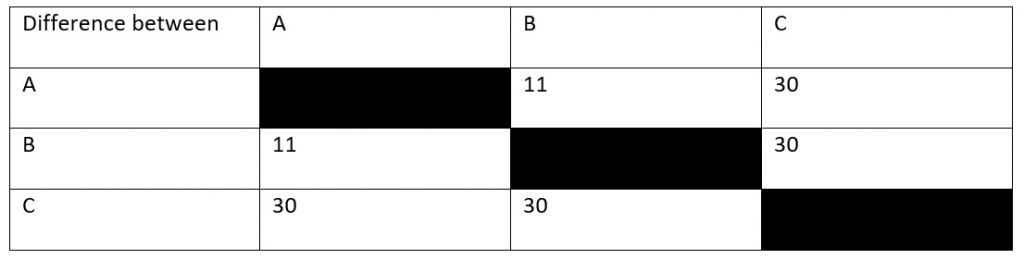
Looking at our table, you can see that, in 15 million years, there have been thirty amino acid sequence changes between species A and species C. However, this doesn’t quite give us our rate of mutation yet. To know why this is the case, you’ve got to consider that both species have been evolving away from their common origin. This means that we’ve effectively got to double the time between them to 30 million years. After all, species A has been evolving for 15 million years and species C has been.

This means that, if we assume a constant mutation rate, we end up with a rate of 1 mutation per million years. What we’ve done is calibrate our molecular clock- we now know the rate of mutation for the protein we’re using to build our tree.

So, let’s now look at the difference between species B and species C, which is also 30 mutations. This means that these two species also had a total evolution time of thirty million years. Dividing by two, we get a divergence time of 15 million years, as with species A. By contrast, species A and species B have eleven amino acid differences, meaning that they must have diverged 5.5 million years ago.

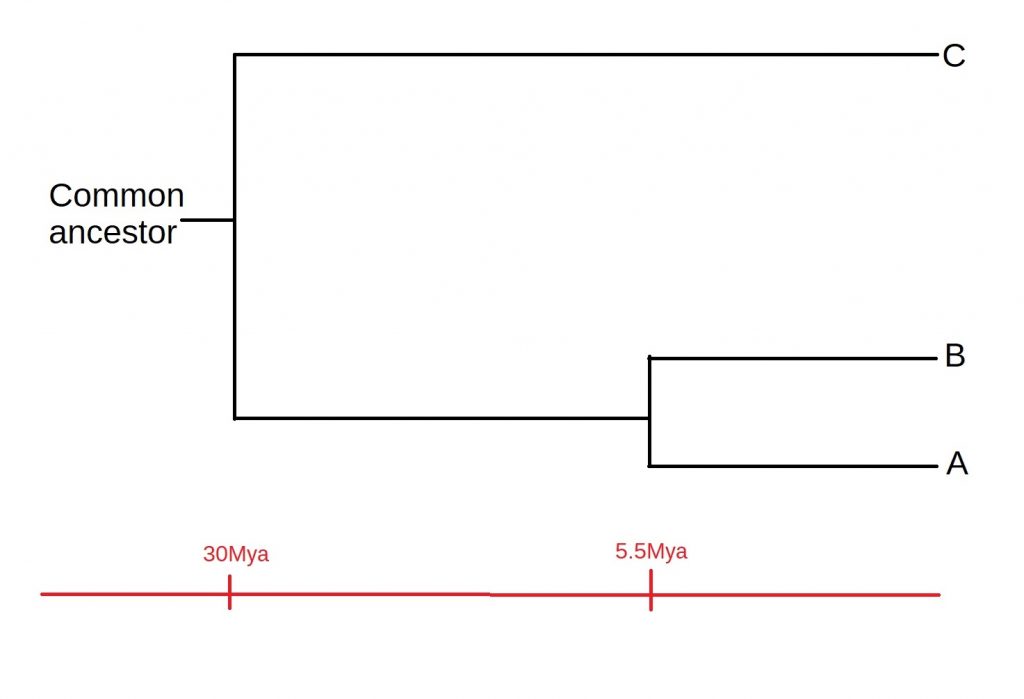
How does all of this fit together? Well, A and B must have diverged after both the A-C divergence or the B-C divergence. This means that C must have split off from the common ancestor first, and then A and B diverged, as shown below:

Figure 1: The phylogenetic tree you end up with as a result of our reconstruction. Time is shown (not to scale) along the bottom)

Of course, there are some assumptions we’ve made while constructing our tree, such as a constant rate of mutation. Added to this, most phylogenies will be a lot more complicated than just three species. However, it serves well as an example of the process by which such tree are constructed. A more in-depth discussion of these assumptions, as well as the process of speciation itself, is a story for another time.

The genetics of porphyria

Image: Pixabay

As we’ve already discussed the genetics of one disease back in episode 14, I’d like to focus on another in the form of porphyria- most famously suffered from by George III. However, this is not an isolated case within his family. In fact, porphyria can be seen throughout the family across the centuries, as I discovered when reading two papers from 1968 and 1982 which focus on the ancestors and immediate family of the king. So what causes porphyria and how is it passed down?

Porphyria is actually a group of diseases, one of the main symptoms of which is an increased secretion of proteins called porphyrins into the urine of patients. Porphyrins can also build up in the liver, which may lead to impeded liver function and an elevated risk of liver cancer. Alternatively, the nervous system can be impacted, which may lead to attacks and hallucination.

In porphyria patients, there is a mutation for the enzyme which produces haem according to the British Liver Trust. For reasons I’ll discuss in a moment, I think that this may actually be referring to haemoglobin– a molecule inside your red blood cells which binds them and allows them to carry oxygen through the blood. Haemoglobin is one of the derivatives of porphyrins, which I believe may be why porphyrins then build up- after all, if haemoglobin can’t be produced correctly, it seems logical that the products from the previous step should build up. For this reason, I believe that the ‘haem’ in the British Liver Trust article may refer to haemoglobin, as stated in the Encyclopaedia Britannica.

Most types of porphyria are inherited in an autosomal dominant fashion, meaning that only one copy of this allele needs to be inherited for symptoms to manifest- which might explain how it symptoms kept cropping up in the family shown below. However, there are rarer versions which are recessive, meaning that both copies of the gene need to be faulty before symptoms manifest.

So, that’s porphyria. As an interesting aside, there’s a 2011 article in the New Scientist which mentions that one sufferer is likely to have been Vlad Dracula, which may have started the idea that vampires can’t abide sunlight. In cutaneous porphyria, areas of the skin exposed to sunlight can become blistered. Afflicted individuals consequently avoid sunlight due to pain. Moreover, their skin may shrink back around the mouth, leading to the impression of fangs. I’m not going to go into it article here, but it’s certainly interesting to think that a disease suffered from by kings through the ages may have led to modern ideas about vampires.

Inbreeding coefficient and how to calculate it

Image: Pixabay

When discussing genetics, people often bandy about the phrase ‘inbreeding coefficient’- essentially a mathematical way of expressing how much inbreeding there is in someone’s ancestry. As an example, Charles II of Spain had an inbreeding coefficient of 0.254, which is higher than the 0.25 which results from the children of a sibling or parent-child union. I haven’t been able to find a public-domain image of Charles II’s ancestry, but have a look at his Wikipedia page if you’re interested in the detail. Sufficed to say, Charles II was not a healthy man, dying at the age of just 39. He had been unable to walk until the age of 8 to 10 and in Spain was known as ‘the Bewitched‘.

There are people who have calculated figures like this for other people. For example, there is a blog post which informed me that Danaerys Targaryen, one of the (many!) point-of-view characters of Game of Thrones would have a coefficient of 0.375. But how is this figure calculated?

Although I haven’t been able to figure out exactly how it works for more complicated puzzles such as the ones we’re discussing, I’m going to take you through the process for some simpler examples, using a method I learned from a blog I’m putting a link to here. Please note that this is a guide to the method, rather than a discussion of the impacts of inbreeding on particular families. However, if this is something people would be interested in, I have found some papers which reconstruct the diseases suffered from by the Ptolemies of Egypt using their symptoms, so if this is something people would be interested in, feel free to let me know in the comments.

So, let’s try and work out the inbreeding coefficient of these two individuals:

Figure 1: The high-tech example tree we’re going to be using. Individuals J and K (circled here in red) are the people we’re going to be calculating an inbreeding coefficient for.

The first thing we need to do is to find the first inbred individuals in the family tree- in this case, J and K, as their parents (G and H) share a set of grandparents and therefore common ancestors. Once we’ve found them, we need to count the number of steps between the two parents:

Figure 2: After identifying the first inbred generation in the tree (J and K in this case), you need to identify the number of ‘steps’ between their parents- the number of steps needed to close the loop, as it were.

In this case, we would need four steps, through the grandparents (A and B) to get from G to H, as shown in Figure 2.

Now the first bit of the equation. Take the number of steps and add one. You might now be breathing a sight of relief, but we’re sadly not done after this point. Now you need to raise 0.5 to the power of this new number. So for our example above, it is (0.5)^5, or 1/32, or 0.03125. This new number needs to be doubled, as this exact same route can be taken through both parents (this wouldn’t be the case if they were related through half-siblings, for example). So, the number you end up with is 0.0625, or 6.25%. So, the coefficient of inbreeding for two individuals born from a first-cousin union is 6.25%, or 1/16th.

But we can go further. What if the children of J and K (let’s call them M and N) marry and have children? How will this impact the inbreeding coefficient of individual P?

Figure 3: The extension of our family tree to include a second set of first cousins marrying.

First off, go through the same process again for these new parents, M and N. You end up with 1/32 for this loop, as you did last time. Double it as before and end up with 1/16th.

But now, we need to go through some more steps. We need to add one to this 1/16th we got last time to get 17/16. This might not seem logical at the moment, but bear with me.

The reason we’re doing this is that this second set of parents don’t start off with a clean slate, if you like- they are inbred themselves, given the marriage of individuals G and H way back in the day. So, the equation for this second set of inbred parents is accordingly more complicated. You need to multiply the number you would otherwise get (1/16th for our purposes) by the 17/16 you just got and then multiply all of that by 2. Why double it? Well, because the number of routes you can take to the original common ancestors A and B has doubled; both M and N can trace their lineage back to them via both G and H. To summarise that logical jump, here’s a diagram:

Figure 4: A summary of the complex equation we discussed above. This multiplication is proportional to the proportion of extra routes we can take. For example, if A and B had been first cousins, you would end up with twice as many routes again, so this bracket would have to be multiplied by four rather than two.

Now the final step, I promise. We now need to add these two numbers together- the original number we got for G and H, and the second number we’ve just calculated for P. So, adding this all together, you get:

1/16 + (1/16 * 17/16 * 2) = 0.1953125, which rounds to 0.195, or 19.5%.

This whole process can be summarised as:

Where (1 + F(A)) refers to the inbreeding coefficient adjusted for the already inbred parents- in our case, the 17/16 we calculated earlier.

Here’s hoping that I’ve managed to explain all of this correctly, as truth be told it took me quite a while to get my head around it. If not, feel free to let me know and I’ll be sure to update this post when I am able to.